Predictive Maintenance hilft Ihnen Wartungsmaßnahmen effizient zu gestalten

Screenshot
Predictive Maintenance zeigt verbleibende Nutzungsdauer von Aufzügen der Deutschen Bahn: klicken, um interaktives Dashboard zu öffnen

Nicht nur die Fertigungskosten lassen sich mit Predictive Maintenance senken. Auch im Dienstleistungsbereich entsteht durch Vorhersagen enormes Optimierungspotential. Im wesentlichen lassen sich die Fragestellungen, die im Rahmen von Predictive Maintenance gestellt werden, in drei Klassen einteilen:

  • Wie hoch ist die Wahrscheinlichkeit, dass ein Gerät in naher Zukunft ausfällt?
  • Was sind die Ursachen von Ausfällen und welche Instandhaltungsmaßnahmen sollten durchgeführt werden, um diese Probleme zu beheben?
  • Wie lang ist die Nutzungsdauer eines Gerätes?

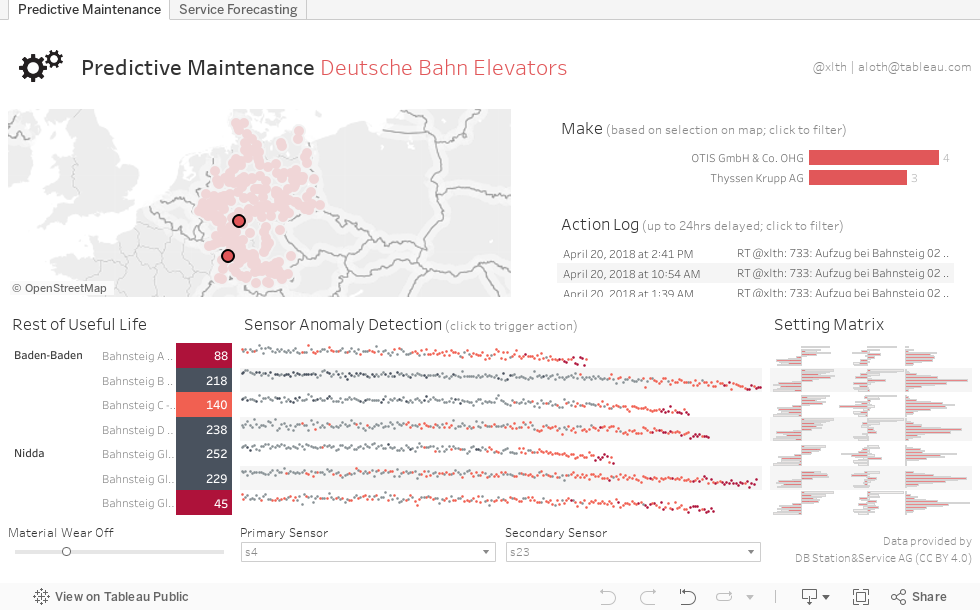
Ein Beispiel, das die Frage der Nutzungsdauer in den Mittelpunkt rückt, zeigt das Dashboard Predictive Maintenance Deutsche Bahn Elevators. Dieses Dashboard sagt voraus, wie lange Aufzüge noch ohne Wartung auskommen („Rest of Useful Life“). Mit dem Parameter „Material Wear Off“ lässt sich zudem der Grad der Abnutzung beeinflussen.

Die visualisierten Sensordaten erlauben darüber hinaus die Möglichkeit Anomalien zu entdecken. Hier lassen sich mit den Parametern „Primary Sensor“ und „Secondary Sensor“ verschiedene Kombinationen analysieren. In der „Setting Matrix“ werden die verschiedene Einstellungen, die beim Betreiben der Aufzüge angewandt werden zusammengefasst.

Details zu den Aufzügen werden im Tooltip angezeigt. In diesen Tooltips lassen sich darüber hinaus Wartungsaufträge via Twitter triggern:


Anstatt auf eine Störung zu reagieren, können Servicetechniker somit auf Vorhersagen zurückgreifen. Damit agieren sie bereits vor einem Ausfall des Aufzugs entsprechend. Techniker sind somit in der Lage einen Aufzug aus der Ferne in den Diagnosemodus zu versetzen und ihn auf einer bestimmten Etage zu parken. All dies führt zu weniger Anfahrtszeiten, gesteigerter Effizienz und geringeren Kosten.

Dieses und weitere Beispiele zeige ich auf meinem Vortrag “Industry 4.0: Self Service BI and Predictive Maintenance“ im Rahmen des IBI Symposium am 17. November 2016 in Stuttgart.

[Update 24 Mar 2017]: Das Predictive Maintenance Dashboard wird außerdem auf der CeBIT 2017 im Rahmen der „neuen datenbasierten Geschäftsmodelle und Big Data bei der DB“ vorgestellt:

Tableau: How to find the most important variables for determining Sales

Random Forest Animation
Interactive dashboard displaying the most important variables for determining the Sales measure in Tableau 10.0 (click screenshot to enlarge)

During the Q&A session of a recent talk on Data Strategy, I was challenged with a rather technical question: I was asked how to identify the variables that are heavily influencing a certain measure – with an interactive solution that matches a modern data strategy as suggested in my presentation.

Of course, this could be done by executing a script. The result however would be static and it would be not convenient for a Business Analyst to run it over and over again. Instead of applying a script every time the data changes, it would be much more innovative to get the answer immediately with every data update or interactivity such as a changed filter.

So why not solve this with Tableau? The magic underneath this easy-to-use Tableau dashboard is a nifty R script, embedded in a calculated field. This script calls a statistical method known as Random Forest, a sophisticated machine learning technique used to rank the importance of variables as described in Leo Breiman’s original paper.

The Tableau Packaged Workbook (twbx) is available here. Do you have more ideas or use cases? Feel free to leave a comment or send me an email: aloth@tableau.com

3 Essential Components to building a Data Strategy

data-strategy-slide
Three core elements of a Data Strategy Plan for the telecommunications industry

Does your enterprise manage data as a corporate asset? Many companies don’t. Here’s how to get started with the three core elements for your Data Strategy Plan.

1. Data

The ongoing digital transformation of our environment has created an enormous amount of data about just every aspect of what we are doing. Every website we visit, every link we click, every search engine term, every purchase is recorded associated either with our online identity if we have logged in, or in a system that saves our session through cookies or digital fingerprinting.

Once gathered, data across the enterprise are typically stored in silos belonging to business functions (vertical silos), business units (horizontal silos), or even different projects within the same division (segmented silo). Making this data a valuable and useful asset will require to break down the silos. This may not be so easy to accomplish, due to ownership issues, regulatory concerns, and governance practices.

2. Analytics

Collecting data alone does not generate value. The completeness of your Advanced Analytics stack and the complexity of the applied models determine how „smart“ your insights will be and therefore how deep the level of business impact will get. Prescriptive and Semantic Analytics might be tough to implement, especially, if you need to find a way to classify semi-structured data, such as social media streams.

While you look to apply sophisticated models, you should not forget to collect the low-hanging fruits and see if you put in all your quantitative information, such as revenue data, to scale out your diagnostic capabilities.

3. Decision-support Tools

Now you need intuitive tools that integrate data into sustainable processes and apply your analytic models to generate information that can be used for your business decisions. Depending on the stakeholder, the outcome might be presented as a self-service web front end, such as a Network Performance Monitor that allows predictive maintenance, or an Executive dashboard that provides your CFO the latest numbers for upcoming M&A.

An important consideration for your decision-support tools is user acceptance. Decision-support tools should be easy to use and should not make processes more complicated. Instead, consider adding buttons that trigger actions directly from the user interface.

This content is part of the session „3 Essential Components to building a Data Strategy“ that I delivered at Telekom Big Data Days 2016. Have a look at my upcoming sessions!

7 Fragen, die Unternehmen helfen ihr Ergebnis mit Social Media zu steigern

Twitter Sentiment Analysis: klicken, um interaktives Dashboard zu öffnen

Ist der Einsatz sozialer Netze in Ihrem Unternehmen auf Marketing beschränkt, und lässt dadurch Chancen ungenutzt?

Noch immer schöpfen viele Unternehmen in Deutschland die Möglichkeiten von Social Media nur unzureichend aus. Die meisten Firmen nutzen Social Media lediglich als Marketinginstrument, senden zum Beispiel in Intervallen die gleichen Inhalte. Wesentlich weniger Unternehmen setzen Social Media dagegen in der externen Kommunikation, in Forschung und Entwicklung, zu Vertriebszwecken, oder im Kundenservice ein.

Nachfolgend betrachten wir die Twitter-Kommunikation von vier Social-Media-affinen Unternehmen etwas näher, und zeigen anhand sieben Fragestellungen was sie anders machen und wo die übrigen Nachholbedarf haben.

1. Wann und wie werden Tweets gesendet?

Ein Blick auf das Histogram lässt auf reichlich Interaktion schließen (Tweets und Replies), während das Weiterverbreiten von Tweets (Retweets) eher sporadisch auftritt:


2. Wie umfangreich sind die Tweets?

Wie es scheint, reitzen die meisten Tweets die von Twitter vorgesehenen 140 Zeichen aus – oder sind zumindest nahe dran:


3. An welchen Wochentagen wird getweetet?

Am Wochenende lässt die Kommunikation via Twitter nach. Die Verteilung der Emotionen bleibt dabei gleich, unterscheidet sich aber von Unternehmen zu Unternehmen:


4. Zu welcher Tageszeit wird getweetet?

Auch nachts werden weniger Tweets verfasst. Bei Lufthansa kommt es dabei recht früh zu einem Anstieg durch Pendler-Tweets, etwas später tritt dieser Effekt bei der Deutschen Bahn ein: 


5. Welche Art der Kommunikation herrscht vor?

Der hohe Anteil an Replies bei Telekom, Deutsche Bahn und Lufthansa impliziert, dass diese Unternehmen Twitter stark zum Dialog nutzen. Unter den Tweets der Deutsche Bank ist hingegen der Anteil an Retweets – insbesondere bei jenen mit Hashtag – deutlich höher, was auf einen höheren Nachrichtengehalt schließen lässt:


6. Welche User sind besonders aktiv?

Nun betrachten wir die Twitter-User, welche die entsprechend Twitter-Handles der Unternehmen besonders intensiv nutzen:


7. Welche Tweets erzeugen Aufmerksamkeit?

Diese Frage lässt sich am besten interaktiv im Dashboard (siehe auch Screenshot oben) untersuchen. Entscheidend ist bei dieser Betrachtung die Ermittlung der Emotion durch eine Sentiment-Analyse.

Je nach Emotion und Kontext ist es vor allem für das adressierte Unternehmen von Interesse rechtzeitig und angemessen zu reagieren. So lässt sich eine negative Stimmung frühzeitig relativieren, und so Schaden an der Marke abwenden. Positive Nachrichten können hingegen durch Weiterreichen als Multiplikator dienen.

R You Ready For Advanced Analytics at #data16

Tableau Conference: "What is Advanced Analytics?"
Tableau Conference: „What is Advanced Analytics?“

The main goal of Advanced Analytics is to help organizations make smarter decisions for better business outcomes.

Only a few years ago, Advanced Analytics was based almost entirely on a complex tool chain and plenty of scripting in Gnuplot, Python and R. Today, Tableau enables us to analyze our data at the speed of thought, to connect to our data sources in seconds, to add dimensions and measures on the canvas by dragging and dropping, and to get insights faster than ever before.

However, R still comes in very handy when we want to enrich Tableau’s Visual Analytics approach with advanced features that enables us to ask questions along the entire Analytics stack:

  1. Descriptive Analytics describes what happened, characterized by traditional business intelligence (BI). E.g. visualizations and dashboards to show profit per store, per product segment, or per region.

  2. Diagnostic Analytics, which is also known as Business Analytics, looks into why something is happening, and is characterized by reports to further „slice and dice“ and drill-down data. It answers the questions raised by Descriptive Analytics, such as why did sales go down in a particular region.

  3. Predictive analytics determines what might happen in future („What might happen?“), and needs larger domain expertise and tool set (i.e. Tableau + R). E.g. regression analysis, and forecasting which product segments are likely to perform better in next quarter.

  4. Prescriptive Analytics identifies the actions required in order to influence particular outcome („What should I do?“). E.g. portfolio optimization, and recommendation engines to answer which customer segment shall be targeted next quarter to improve profitability.

  5. Semantic Analytics examines data or content to identify the meaning („What does it mean?“), and suggests what you are looking for and provides a richer response. E.g. sentiment analysis and Latent Semantic Indexing to understand social media streams.

Do you want to learn more about Advanced Analytics and how to leverage Tableau with R? Meet me at the Tableau Conference in Munich (5-7 July) where I deliver the session „R You Ready For Advanced Analytics“.

"Analytics is essential for any competitive strategy"
„Analytics is essential for any competitive strategy“ (further reading: data science + strategy)