Tag: TableauBuch
-
Die Schlüsselrolle der Datenkompetenz in der digitalen Transformation: Ein Gespräch mit Dilyana Bossenz – Neue Folge von “Die Digitalisierung und Wir”
In unserer neuesten Folge von “Die Digitalisierung und Wir” haben wir Dilyana Bossenz zum Thema Datenkompetenz interviewt. Dilyana ist Dozentin für Data Visualization & Communication an der Digital Business University of Applied Sciences (DBU) in Berlin und Gründerin von Datenkompetenz-Online, einer Schulungsplattform für Unternehmen, die ihre Mitarbeiter in die Welt der Daten einführen wollen. Dilyana…
-
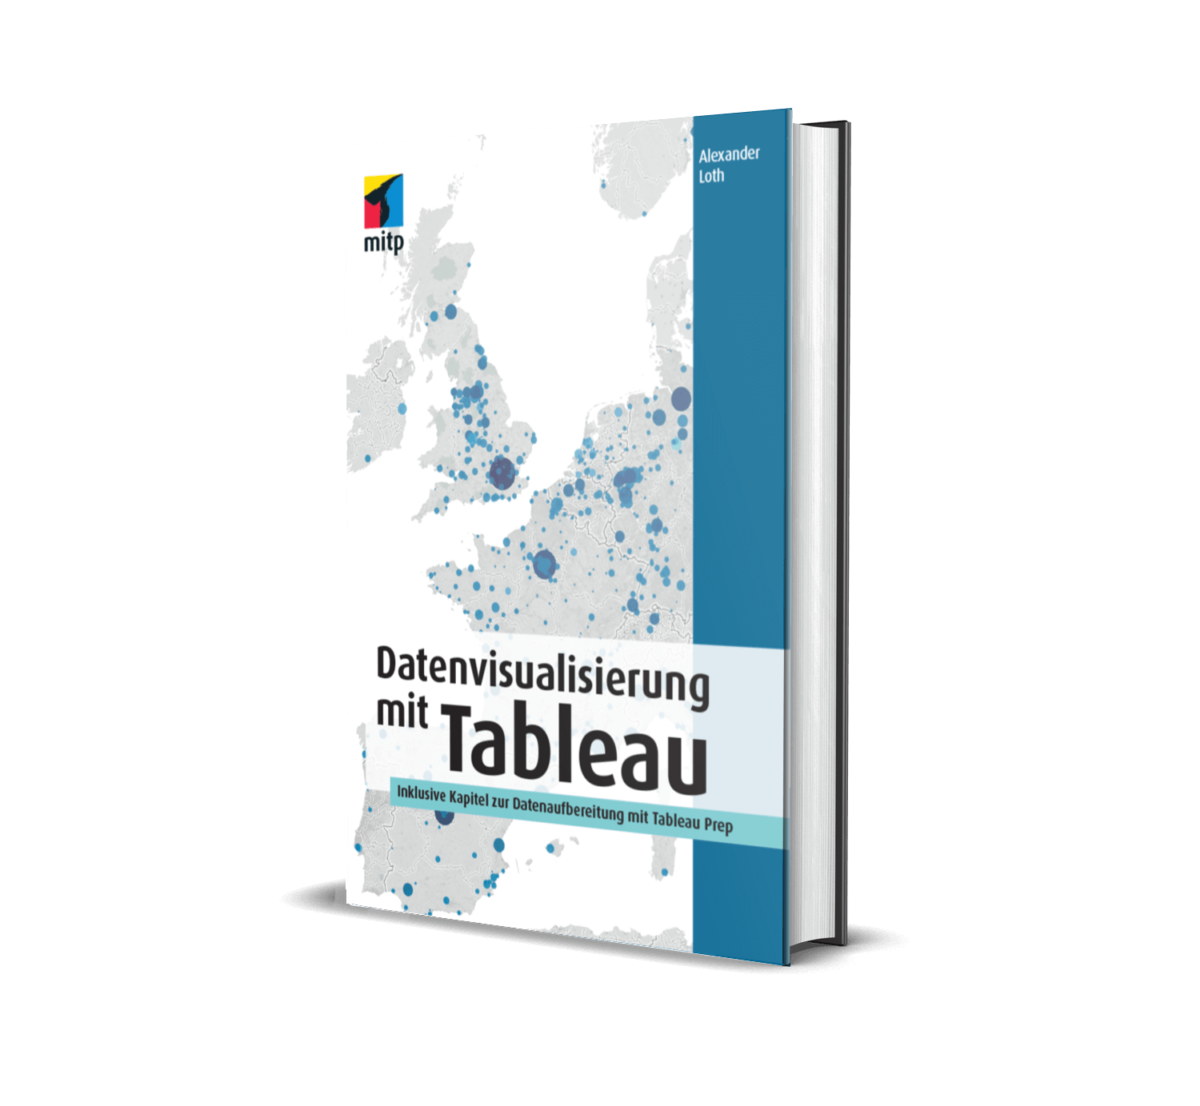
Datenvisualisierung mit Tableau: 2. Auflage des Tableau-Buchs ab heute verfügbar
Heute ist ein spannender Tag für alle Datenvisualisierungsfans und Tableau-Nutzer: die zweite, verbesserte und erweiterte Auflage des populären 📖Datenvisualisierung-mit-Tableau-Buchs ist ab sofort verfügbar! Dieses aufschlussreiche und praktische Handbuch ist Ihr Tor zu effektiver und intuitiver Datenvisualisierung mit Tableau, einer der führenden Plattformen in diesem Bereich. Die neueste Ausgabe zeichnet sich nicht nur durch ein auffälliges,…
-
Datenvisualisierung mit Tableau: Geben Sie mir Feedback für die 2. Auflage des Tableau-Buchs
Wow, es ist noch gar nicht lange her, seit mein Buch Datenvisualisierung mit Tableau veröffentlicht wurde! Ich danke allen Lesern für die vielen postiven Rückmeldungen und freue mich, dass mein Buch Ihnen hilft Erkenntinsse aus Ihren Daten abzuleiten und diese im Unternehmen zu teilen. Die erste Auflage des Tableau-Buchs ist nun auch schon fast ausverkauft.…
