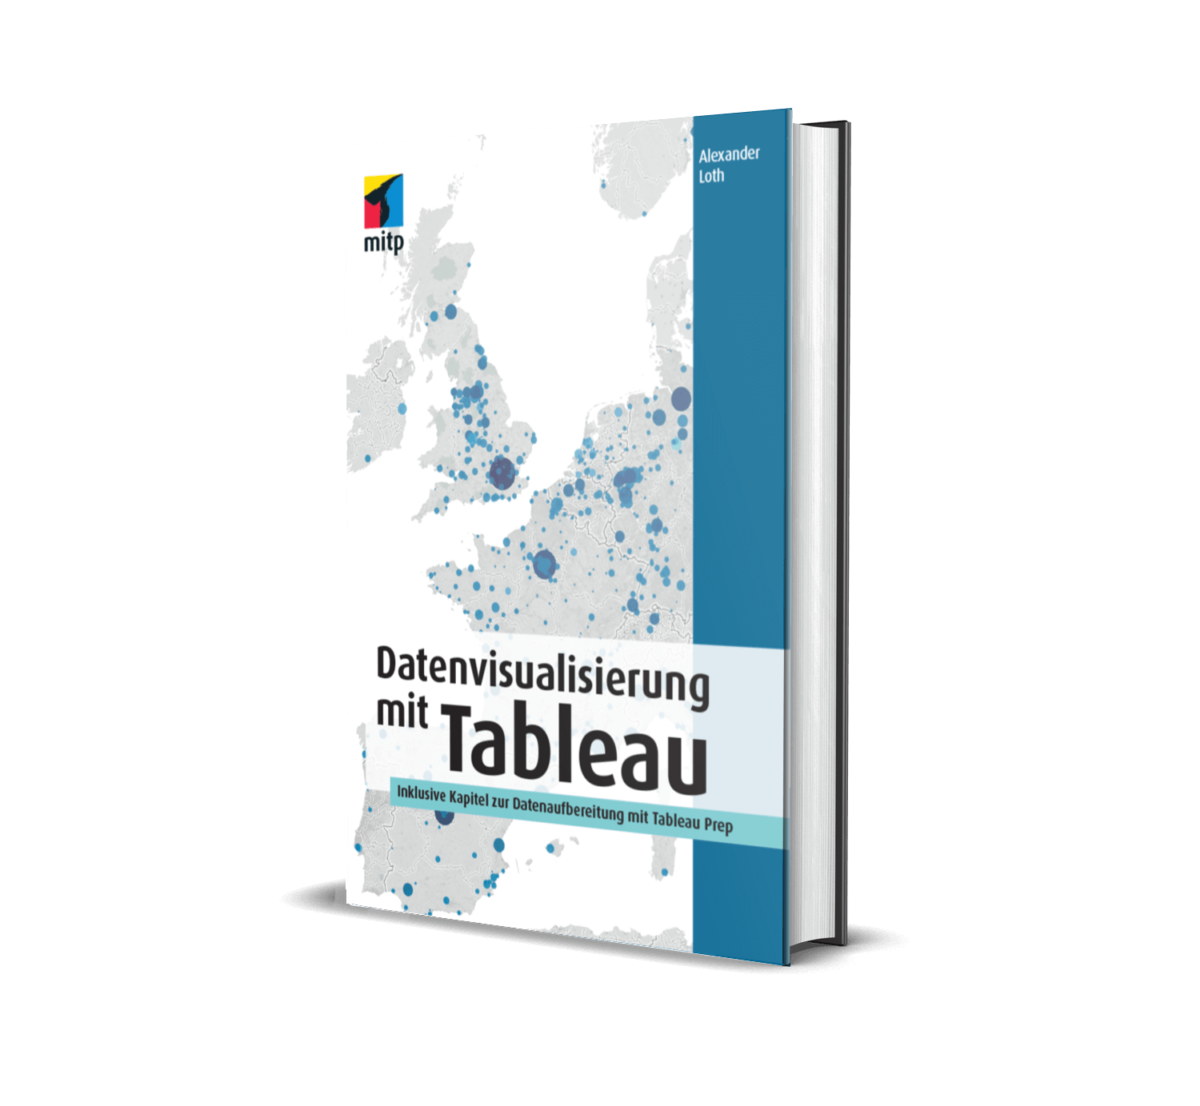
Datenvisualisierung mit Tableau: Geben Sie mir Feedback für die 2. Auflage des Tableau-Buchs

Wow, es ist noch gar nicht lange her, seit mein Buch Datenvisualisierung mit Tableau veröffentlicht wurde! Ich danke allen Lesern für die vielen postiven Rückmeldungen und freue mich, dass mein Buch Ihnen hilft Erkenntinsse aus Ihren Daten abzuleiten und diese im Unternehmen zu teilen.

Die erste Auflage des Tableau-Buchs ist nun auch schon fast ausverkauft. Daher stellt sich jetzt die Frage, ob es einen Nachdruck geben wird, oder ob es bereits Potential für eine erweiterte zweite Auflage des Tableau-Buchs gibt. Um das zu entscheiden, freue mich auf Ihr Feedback!

Schreiben Sie mir dazu einfach per Email: feedback@alexloth.com – oder via Twiter:

Alle Ideen, Anregungen und Änderungsvorschläge für eine mögliche zweite Auflage sind herzlich willkommen!

Update vom 23.07.2021: Die zweite, erweiterte Auflage von Datenvisualisierung mit Tableau ist ab sofort erhältlich!

#datamustread: How to Master Your Data Journey

From ideas to dashboards: The essential books for mastering your Data Journey, featuring 'Info We Trust', 'Visual Analytics with Tableau', and 'The Big Book of Dashboards'.
From ideas to dashboards: The essential books for mastering your Data Journey, featuring ‚Info We Trust‘, ‚Visual Analytics with Tableau‘, and ‚The Big Book of Dashboards‘.

Today, data is at the core of everything we do, but the journey to mastering it can be overwhelming. Last year I started lecturing a Data Analytics course at university (as part of an MBA program). In the meanwhile, I was refining the list of books that I highly recommend to read. Three of these books form the Data Journey!

The Data Journey: A Human-Focused Approach to Data Storytelling

The Data Journey is not just about numbers; it’s about understanding the evolution of data, the power of visualization, and how it all connects to real-world business. Here are the books that will guide you on this path:

1. Info We Trust: How to Inspire the World with Data

Begin your Data Journey with a deep dive into data storytelling. Info We Trust explores data lifecycle across disciplines, with inspiring references and hand-drawn illustrations. It’s a must-read for anyone serious about data communication.

This book examines all parts of the data storytelling lifecycle across disciplines. The use of marginalia and hand-drawn illustrations give you both simple lessons to take away and insights into where to find out more. The book is full of magnificent references that inspire further reading.

2. Visual Analytics with Tableau

Ready for hands-on experience? My book, Visual Analytics with Tableau, provides a step-by-step guide to mastering Tableau, from basic chart creation to advanced statistical modeling. With Tableau available for free to students, there’s no reason not to dive in!

Visual Analytics with Tableau covers everything you need to get started with Tableau (students get Tableau for free!). The book guides you from the first steps of connecting to data, creating different types of charts, and adding calculation fields to more advanced features such as table calculations, forecasts, and clusters, as well as R, Python, and MATLAB integration for sophisticated statistical modeling.

3. The Big Book of Dashboards: Visualizing Your Data Using Real-World Business Scenarios

Back to business (as this course is designed for an MBA program). We close our Data Journey canon with The Big Book of Dashboards. This is a comprehensive reference book with real-world solutions for business dashboards and a detailed analysis of do’s and don’ts.

This comprehensive reference book offers real-world solutions for business dashboards. It’s a practical guide to understanding do’s and don’ts in data visualization, categorized by industry and functional business areas.

Need More Inspiration for Mastering Data Journey? #MakeoverMonday: Improving How We Visualize and Analyze Data, One Chart at a Time

Because vizzing alone is only half the fun, you should not miss the #MakeoverMonday book. Eva Murray and Andy Kriebel are icons in the data visualization community (read the interview!) and they have curated the thousands of visualizations from the #MakeoverMonday project into a practical guide that will take your design and data communication skills to the next level!

The #MakeoverMonday book by Eva Murray and Andy Kriebel is a treasure trove of data visualization insights. It’s a practical guide to enhancing your design and communication skills.

Join the Conversation: Your Recommendations for the #DataJourney

Interested in more insights on data visualization, analytics, and Tableau? Follow me on Twitter and LinkedIn, and let’s continue learning together. And don’t forget to check out my book Visual Analytics with Tableau to take your data journey to the next level!

What other books have inspired you on your data journey? Share your favorite data books in the blog post comments or reply to this tweet:

Visual Analytics with Tableau: Book is in Stock again

Visual Analytics with Tableau on Amazon screenshot
Visual Analytics with Tableau is on stock again: Screenshot shows availability on amazon.com

Did you get your Tableau Conference Europe 2019 ticket and now need something to read for the journey?

Then I have some good news: Right on time, just a few weeks before TCE19, my new book Visual Analytics with Tableau is in stock again:

As you know from my previous Tableau Conference sessions and blog posts (TC18, TC17, TC16), I love social media! So thank you for your likes, shares, retweets…

Instagram ❤️

Twitter ❤️

Facebook ❤️

LinkedIn ❤️

Visual Analytics with Tableau: Unleash Your Data’s Potential with the Tableau Book

Visual Analytics with Tableau book cover

Today marks a significant milestone in my journey with data visualization – the release of my comprehensive Tableau book, Visual Analytics with Tableau (Amazon). This book is more than just a guide; it’s a comprehensive resource for unlocking the power of visual analytics. Also, check out the Visual Analytics with Tableau companion website for further news.

From the Back Cover

A 4-COLOR JOURNEY THROUGH A COMPLETE TABLEAU VISUALIZATION FOR NON-TECHNICAL BUSINESS USERS

Tableau is a popular data visualization and analytics tool favored by financial analysts, marketers, statisticians, business and sales professionals, data scientists, developers, and many others who need to explore insights and present visual, easy-to-understand data. Visual Analytics with Tableau is an accessible, step-by-step introduction to the world of visual analytics. This up-to-date guide is ideal for both beginners and more experienced users seeking a practical introduction to the fields of data analysis and visualization. Through hands-on examples and exercises, readers learn how to analyze their own data and clearly communicate the results.

This guide covers everything you need to get started with Tableau, from the first steps of connecting to data, creating different types of charts, and adding calculation fields to more advanced features such as table calculations, forecasts, clusters, and R, Python, and MATLAB integration for sophisticated statistical modelling. User-friendly instructions for existing options within the Tableau ecosystem–Tableau Desktop, Tableau Prep, Tableau Server, Tableau Online, and Tableau Public–enable you to integrate, clean, and prepare your data and share your work with others.

Why Choose Visual Analytics with Tableau?

  • Latest Versions Covered: Stay up-to-date with the newest features of Tableau, plus Tableau Prep, Tableau’s cutting-edge data integration application.
  • No Prior Experience Required: Whether you’re a beginner or an expert, this book caters to all. No background in mathematics or programming is needed.
  • Exploring Data Visually: This book Focuses on the visual analytics functionality of Tableau rather than complex statistical programming.
  • Expert Guidance: Gain insights from Alexander Loth, Tableau’s thought leader, and world-renowned visualization expert. Alexander’s hands-on approach ensures a smooth learning curve.
  • Advanced Functionality: Dive deep into advanced Tableau functionalities and explore various data structures to elevate your analytical capabilities.
  • Top-notch Presentation: This book provides easy-to-follow instructions, full-color illustrations, learning tools, online resources, and more.

Endorsements

If you’re getting started with visual analytics and Tableau, this book will teach you everything you need to know to build the foundations and understand how and why to explore your data visually. Alexander has created a fantastic resource that guides you step by step through the process of preparing your data, using Tableau Desktop to analyse it and finding insights.

Eva Murray, Head of BI and Tableau Zen Master at Exasol

If you’re keen to go from beginner to expert in Tableau, Alexander’s excellent book gives you everything you need to know. With a crisp and clear style, he talks the reader through all aspects of Tableau, from data cleaning through data analysis and into sharing insight with others.

Andy Cotgreave, Author of Big Book of Dashboards and Technical Evangelist at Tableau Software

Visual Analytics with Tableau – an easy to understand book by Alexander Loth, one of Tableau’s very first employees based in Germany, a recognized speaker on countless conferences, and a Tableau Jedi. It contains both the basics and advanced Tableau features. If you ask me: there is nothing more you need to get started with Tableau!

Klaus Schulte, Professor at Münster School of Business & 2019 Tableau Zen Master

Get Your Copy of Visual Analytics with Tableau and Stay Connected!

Thank you to everyone who contributed to the success of this book! Grab your copy of Visual Analytics with Tableau on Amazon and embark on an enlightening journey through visual analytics. If you’re new to Tableau, don’t miss my blog post on joining a Tableau User Group, where you can learn, connect, and grow your skills.

Stay in touch for more insights on data visualization, analytics, and digital transformation. Follow me on Twitter and LinkedIn, and let’s continue learning together:

Data Operations: Wie Sie die Performance Ihrer Datenanalyse und Dashboards steigern

#dataops: Folgen Sie der Diskussion auf Twitter

Sind Sie mit der Geschwindigkeit Ihrer Datenanlyse unzufrieden? Oder haben Ihre Dashboards lange Ladezeiten? Dann können Sie bzw. Ihr Datenbank-Administrator folgenden Hinweisen nachgehen, die sich je nach Datenquelle unterscheiden können.

Allgemeine Empfehlungen zur Performance-Optimierung

Möchten Sie die Geschwindigkeit der Analyse verbessern? Dann beachten Sie folgende Punkte:

  • Benutzen Sie mehrere »kleinere« Datenquellen für individuelle Fragestellungen anstatt einer einzigen Datenquelle, die alle Fragestellungen abdecken soll.
  • Verzichten Sie auf nicht notwendige Verknüpfungen.
  • Aktivieren Sie in Tableau die Option »Referentielle Integrität voraussetzen« im »Daten«-Menü (siehe Abbildung 2.20). Wenn Sie diese Option verwenden, schließt Tableau die verknüpften Tabellen nur dann in die Datenabfrage ein, wenn sie explizit in der Ansicht verwendet wird*. Wenn Ihre Daten nicht über referentielle Integrität verfügen, sind die Abfrageergebnisse möglicherweise ungenau.

Aktivierte Option „Referentielle Integrität voraussetzen“ im „Daten“-Menü
Abbildung 2.20: Aktivierte Option »Referentielle Integrität voraussetzen« im »Daten«-Menü

* So wird beispielsweise der Umsatz anstatt mit der SQL-Abfrage SELECT SUM([Sales Amount]) FROM [Sales] S INNER JOIN [Product Catalog] P ON S.ProductID = P.ProductID lediglich mit der SQL-Abfrage SELECT SUM([Sales Amount]) FROM [Sales] ermittelt.

Empfehlungen für Performance-Optimierung bei Dateien und Cloud-Diensten

Achten Sie insbesondere beim Arbeiten mit Dateiformaten, wie Excel-, PDF- oder Textdateien, oder Daten aus Cloud-Diensten wie Google Tabellen zusätzlich auf folgende Punkte:

  • Verzichten Sie auf Vereinigungen über viele Dateien hinweg, da deren Verarbeitung sehr zeitintensiv ist.
  • Nutzen Sie einen Datenextrakt anstatt einer Live-Verbindung, falls Sie nicht mit einem schnellen Datenbanksystem arbeiten (siehe Wann sollten Sie Datenextrakte und wann Live-Verbindungen verwenden).
  • Stellen Sie sicher, dass Sie beim Erstellen des Extrakts die Option »Einzelne Tabelle« wählen, anstatt der Option »Mehrere Tabellen« (siehe Abbildung 2.21). Dadurch wird das erzeugte Extrakt zwar größer und das Erstellen des Extrakts dauert länger, das Abfragen hingegen wird um ein Vielfaches beschleunigt.

Ausgewählte Option „Einzelne Tabelle“ im „Daten extrahieren“-Dialog
Abbildung 2.21: Ausgewählte Option »Einzelne Tabelle« im »Daten extrahieren«-Dialog

Empfehlungen für Performance-Optimierung bei Datenbank-Servern

Arbeiten Sie mit Daten auf einem Datenbank-Server, wie Oracle, PostgreSQL oder Microsoft SQL Server, und möchten die Zugriffszeiten verbessern? Dann achten Sie bzw. der dafür zuständige Datenbankadministrator zusätzlich auf folgende Punkte:

  • Definieren Sie für Ihre Datenbank-Tabellen sinnvolle Index-Spalten.
  • Legen Sie für Ihre Datenbank-Tabellen Partitionen an.

Dieser Beitrag ist der dritte Teil der Data-Operations-Serie:

Teil 1: Daten für die Analyse optimal vorbereiten
Teil 2: Wann sollten Sie Datenextrakte und wann Live-Verbindungen verwenden
Teil 3: Wie Sie die Performance Ihrer Datenanalyse und Dashboards steigern

Außerdem basiert dieser Blog-Post auf einem Unterkapitel des Buches „Datenvisualisierung mit Tableau„: