Datenvisualisierung mit Tableau: 2. Auflage des Tableau-Buchs ab heute verfügbar

Tableau Buch - 1. Auflage und 2. Auflage nebeneinader
Tableau Buch – 1. Auflage und 2. Auflage nebeneinader

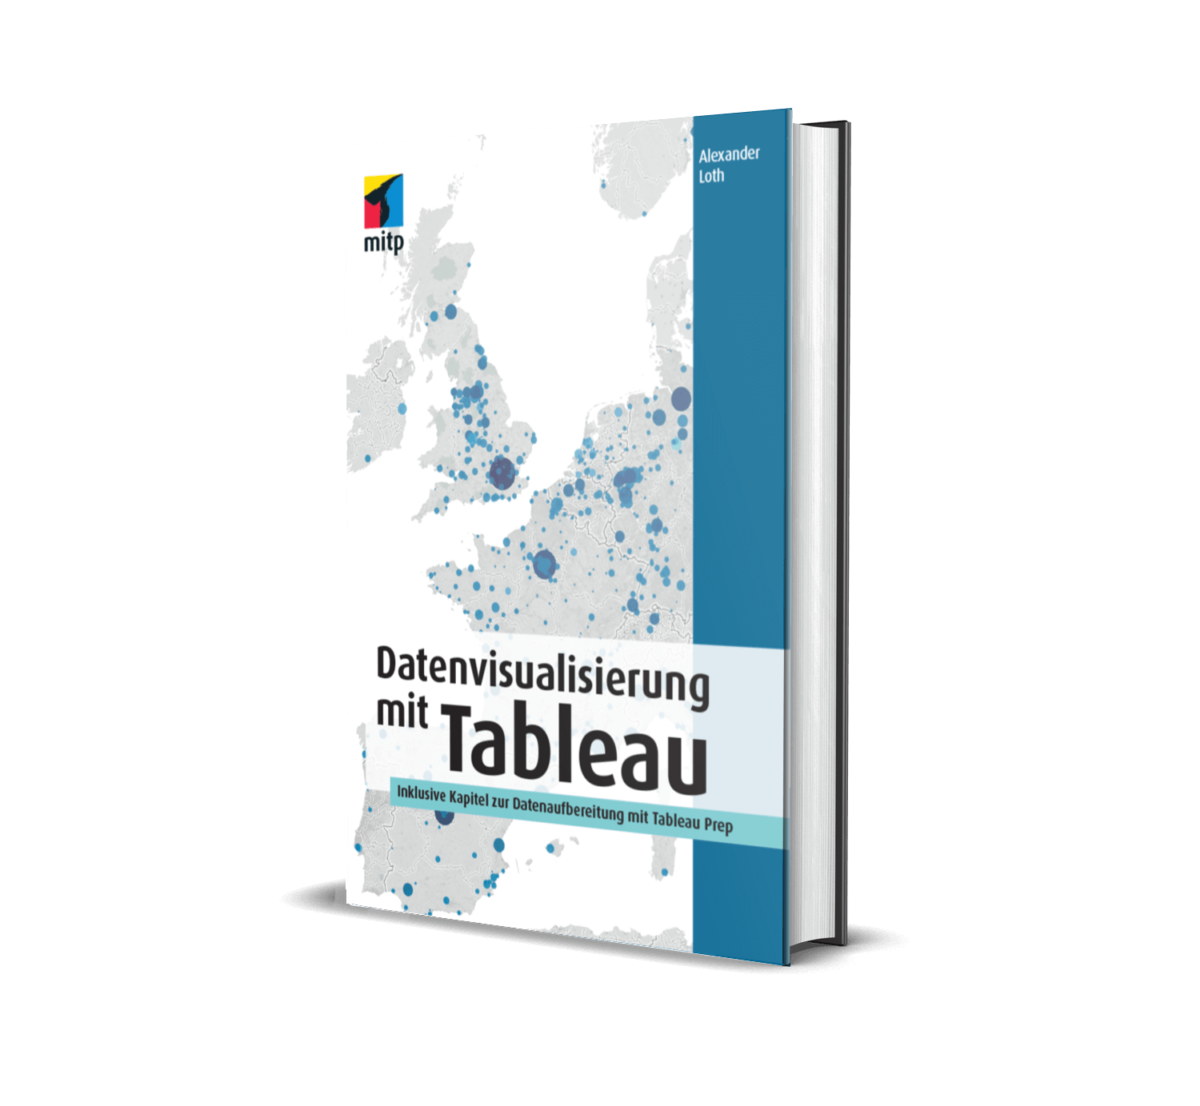
Heute ist ein spannender Tag für alle Datenvisualisierungsfans und Tableau-Nutzer: die zweite, verbesserte und erweiterte Auflage des populären 📖Datenvisualisierung-mit-Tableau-Buchs ist ab sofort verfügbar! Dieses aufschlussreiche und praktische Handbuch ist Ihr Tor zu effektiver und intuitiver Datenvisualisierung mit Tableau, einer der führenden Plattformen in diesem Bereich.

Die neueste Ausgabe zeichnet sich nicht nur durch ein auffälliges, strahlend orangefarbenes Cover aus, sondern beinhaltet auch rund 50 Seiten mit zusätzlichem Inhalt und eine Fülle von neuen praktischen Tipps. Basierend auf der aktuellen Version von Tableau Desktop, wurde die orange Edition mit dem Ziel erstellt, Ihre Fähigkeiten in der Datenvisualisierung zu verbessern und zu erweitern.

Wir möchten unsere Dankbarkeit gegenüber Dilyana Bossenz, Klaus Schulte, Martin Pohlers und Bhagat Singh Ransi aussprechen, deren Ideen und Unterstützung wesentlich zur Verbesserung dieses Tableau-Buchs beigetragen haben.

Das Buch Datenvisualisierung mit Tableau ergänzt perfekt meine anderen Bücher, insbesondere Decisively Digital: From Creating a Culture to Designing Strategy (Amazon). Diese Bücher bilden zusammen eine umfassende Ressource, die Ihnen hilft, die Kunst der Datenvisualisierung zu meistern und die digitale Transformation in Ihrem Unternehmen voranzutreiben.

Besuchen Sie unsere Begleit-Website zu Datenvisualisierung mit Tableau, um weitere Informationen und Ressourcen zu erhalten: https://www.visual-analytics.org/mit-tableau/

Um die zweite Auflage von Datenvisualisierung mit Tableau zu erwerben, fragen Sie in der Buchhandlung Ihres Vertrauens oder bestellen Sie das Tableau-Buch bei Amazon.

Ideen und Anregungen sind auf LinkedIn und auf Twitter herzlich willkommen:

„Datenvisualisierung mit Tableau: 2. Auflage des Tableau-Buchs ab heute verfügbar“ weiterlesen

Visual Analytics with Tableau is the #1 Best-Selling Business Intelligence Tools Book on Amazon

Visual Analytics with Tableau is #1 Business Intelligence Tools book on Amazon. Unlock the secrets of Tableau with this #1 best-selling Tableau book. Perfect for those seeking the best way to learn Tableau, it stands out as a top data visualization book.
Unlock the secrets of Tableau with this #1 best-selling Tableau book. Perfect for those seeking the best way to learn Tableau, it stands out as a top data visualization book.

I am thrilled to share some fantastic news with my readers and the data visualization community: My book, Visual Analytics with Tableau, has reached the pinnacle of success on Amazon, taking the #1 spot in the Business Intelligence Tools category. This achievement marks a significant milestone in my journey as an author and is a testament to the powerful impact Tableau is having in the world of data visualization and business intelligence.

The Data Visualization Book for Everyone

Writing Visual Analytics with Tableau was a labor of love and expertise, driven by my passion for helping others unlock the full potential of their data. Designed for both beginners and seasoned professionals, the book provides comprehensive insights and practical guidance for using Tableau to transform raw data into meaningful visual stories.

The journey to becoming the #1 bestselling book on business intelligence tools on Amazon was not a solo effort. It was made possible by the incredible support and feedback from the #DataFam community, a network of Tableau enthusiasts and experts who share a common goal: to excel in the art and science of data visualization.

The Best Way to Learn Tableau

Visual Analytics with Tableau stands out as a resource for learning and mastering Tableau, making it an essential reading for anyone looking to improve their data visualization skills. Whether you are a student, business professional, or aspiring data scientist, this book provides valuable insights and hands-on experience to help you navigate the world of Tableau with confidence.

Beyond its instructional value, Visual Analytics with Tableau also serves as a guide for organizations seeking to foster a data-driven culture. By implementing the techniques and best practices outlined in the book, organizations can make more informed decisions, uncover hidden insights, and drive innovation.

The Tableau book: A Note of Gratitude

I am incredibly grateful to our #datafam who has supported this project, from its early conceptual stages to its realization as a bestselling book. Your ideas, feedback, and enthusiasm have helped make Visual Analytics with Tableau a valuable and unique resource in the field of business intelligence and data visualization.

I encourage everyone to spread the word about Visual Analytics with Tableau and join the growing community of data enthusiasts who are reshaping the way we understand and interact with data. Together, we can continue to push the boundaries of what’s possible with Tableau and data visualization!

„Visual Analytics with Tableau is the #1 Best-Selling Business Intelligence Tools Book on Amazon“ weiterlesen

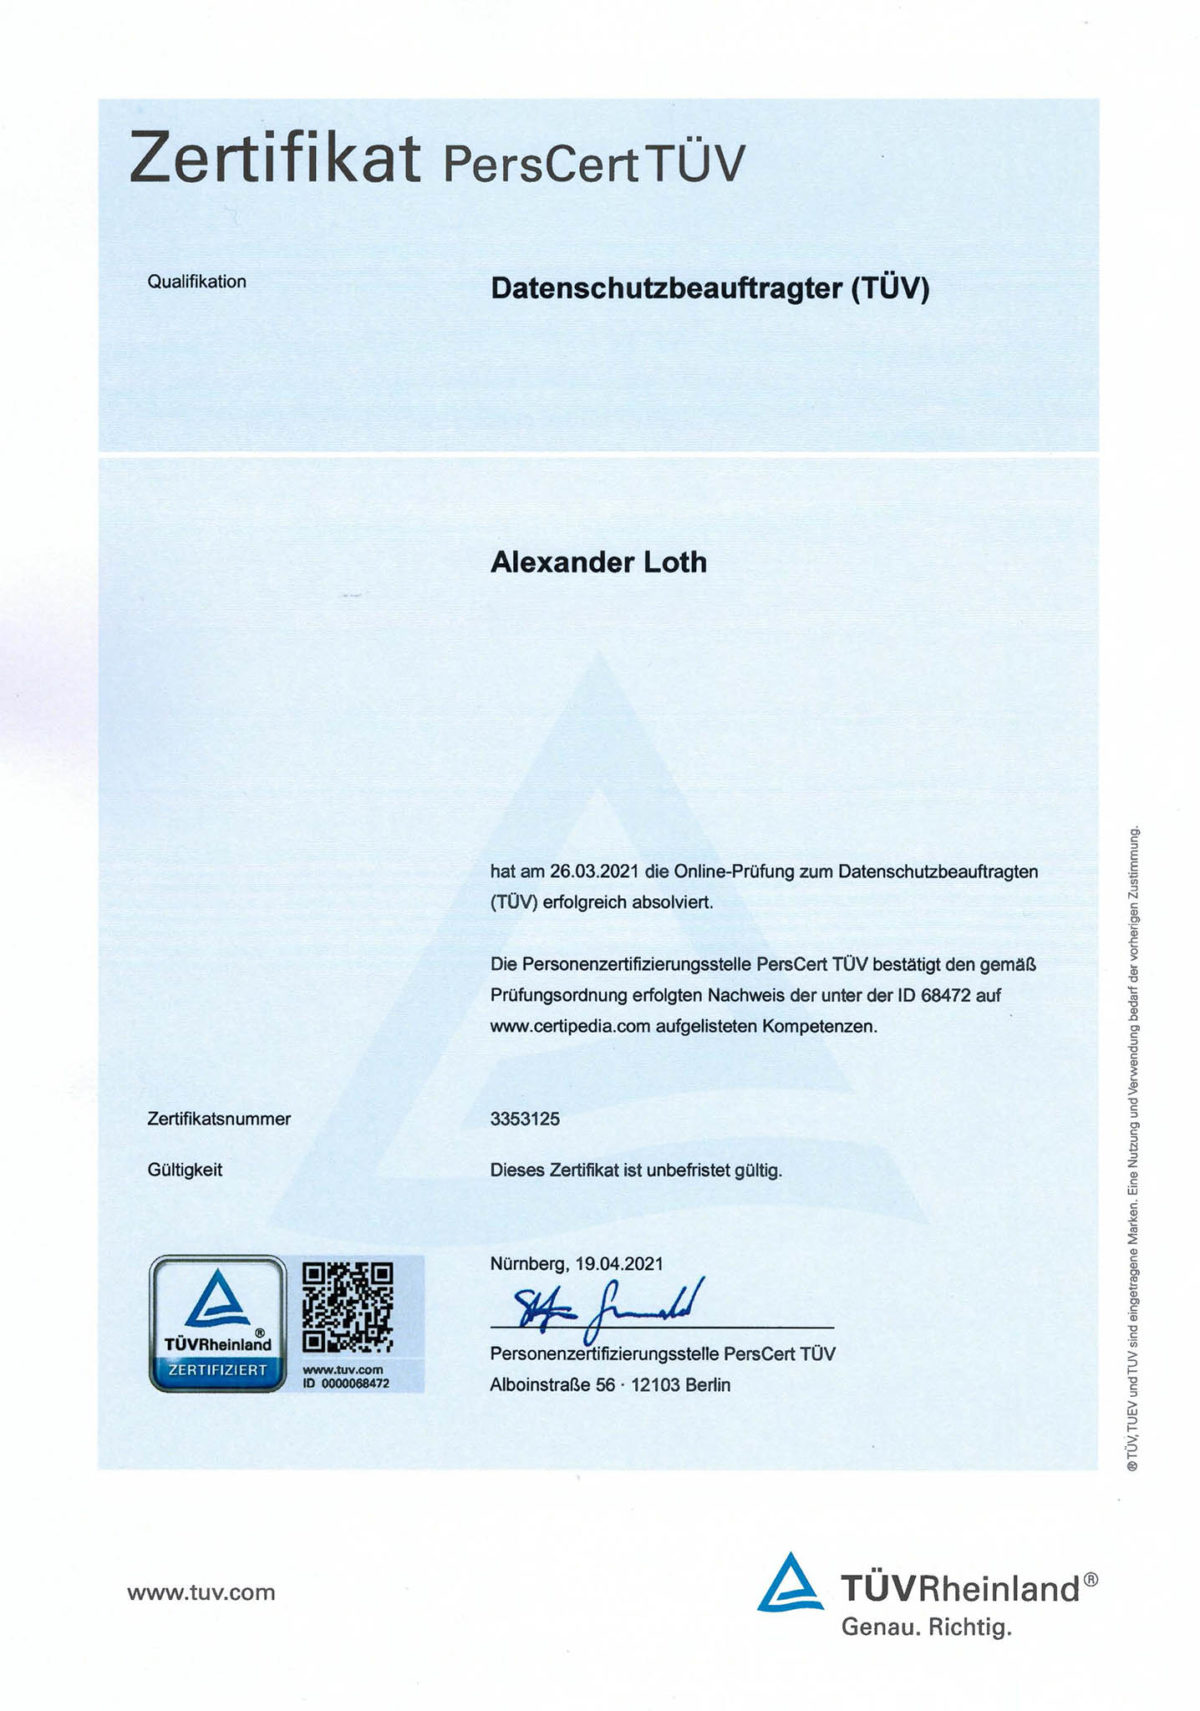
Taking a different perspective: certified Data Protection Officer

Taking a different perspective: now I am a certified data protection officer (Datenschutzbeauftragter (TÜV)).

The required one-week training was packed with insights on how data processing can be made globally compliant with GDPR. I look forward to advising our customers on how organizations can effectively implement GDPR from a technical and organizational perspective.

What are the topics covered by this certification?

In the examination, the participants demonstrate knowledge in the following areas:

      • Data Privacy
      • Organization of Data Protection and Data Security in the company
      • Operational tasks of the Supervisor

„Data Protection Officers (TÜV)“ have assured knowledge in the sense of Art. 37 (5) EU Data Protection Basic Regulation. They are familiar with the legal provisions on data protection (e.g. EU-DSGVO, new BDSG), the tasks, rights and duties of the data protection officer and the components of an efficient data protection management system. You are able to implement and maintain the basic features of such a system.

Source: TÜVRheinland Certipedia

Datenvisualisierung mit Tableau: Geben Sie mir Feedback für die 2. Auflage des Tableau-Buchs

Wow, es ist noch gar nicht lange her, seit mein Buch Datenvisualisierung mit Tableau veröffentlicht wurde! Ich danke allen Lesern für die vielen postiven Rückmeldungen und freue mich, dass mein Buch Ihnen hilft Erkenntinsse aus Ihren Daten abzuleiten und diese im Unternehmen zu teilen.

Die erste Auflage des Tableau-Buchs ist nun auch schon fast ausverkauft. Daher stellt sich jetzt die Frage, ob es einen Nachdruck geben wird, oder ob es bereits Potential für eine erweiterte zweite Auflage des Tableau-Buchs gibt. Um das zu entscheiden, freue mich auf Ihr Feedback!

Schreiben Sie mir dazu einfach per Email: feedback@alexloth.com – oder via Twiter:

Alle Ideen, Anregungen und Änderungsvorschläge für eine mögliche zweite Auflage sind herzlich willkommen!

Update vom 23.07.2021: Die zweite, erweiterte Auflage von Datenvisualisierung mit Tableau ist ab sofort erhältlich!

#datamustread: How to Master Your Data Journey

From ideas to dashboards: The essential books for mastering your Data Journey, featuring 'Info We Trust', 'Visual Analytics with Tableau', and 'The Big Book of Dashboards'.
From ideas to dashboards: The essential books for mastering your Data Journey, featuring ‚Info We Trust‘, ‚Visual Analytics with Tableau‘, and ‚The Big Book of Dashboards‘.

Today, data is at the core of everything we do, but the journey to mastering it can be overwhelming. Last year I started lecturing a Data Analytics course at university (as part of an MBA program). In the meanwhile, I was refining the list of books that I highly recommend to read. Three of these books form the Data Journey!

The Data Journey: A Human-Focused Approach to Data Storytelling

The Data Journey is not just about numbers; it’s about understanding the evolution of data, the power of visualization, and how it all connects to real-world business. Here are the books that will guide you on this path:

1. Info We Trust: How to Inspire the World with Data

Begin your Data Journey with a deep dive into data storytelling. Info We Trust explores data lifecycle across disciplines, with inspiring references and hand-drawn illustrations. It’s a must-read for anyone serious about data communication.

This book examines all parts of the data storytelling lifecycle across disciplines. The use of marginalia and hand-drawn illustrations give you both simple lessons to take away and insights into where to find out more. The book is full of magnificent references that inspire further reading.

2. Visual Analytics with Tableau

Ready for hands-on experience? My book, Visual Analytics with Tableau, provides a step-by-step guide to mastering Tableau, from basic chart creation to advanced statistical modeling. With Tableau available for free to students, there’s no reason not to dive in!

Visual Analytics with Tableau covers everything you need to get started with Tableau (students get Tableau for free!). The book guides you from the first steps of connecting to data, creating different types of charts, and adding calculation fields to more advanced features such as table calculations, forecasts, and clusters, as well as R, Python, and MATLAB integration for sophisticated statistical modeling.

3. The Big Book of Dashboards: Visualizing Your Data Using Real-World Business Scenarios

Back to business (as this course is designed for an MBA program). We close our Data Journey canon with The Big Book of Dashboards. This is a comprehensive reference book with real-world solutions for business dashboards and a detailed analysis of do’s and don’ts.

This comprehensive reference book offers real-world solutions for business dashboards. It’s a practical guide to understanding do’s and don’ts in data visualization, categorized by industry and functional business areas.

Need More Inspiration for Mastering Data Journey? #MakeoverMonday: Improving How We Visualize and Analyze Data, One Chart at a Time

Because vizzing alone is only half the fun, you should not miss the #MakeoverMonday book. Eva Murray and Andy Kriebel are icons in the data visualization community (read the interview!) and they have curated the thousands of visualizations from the #MakeoverMonday project into a practical guide that will take your design and data communication skills to the next level!

The #MakeoverMonday book by Eva Murray and Andy Kriebel is a treasure trove of data visualization insights. It’s a practical guide to enhancing your design and communication skills.

Join the Conversation: Your Recommendations for the #DataJourney

Interested in more insights on data visualization, analytics, and Tableau? Follow me on Twitter and LinkedIn, and let’s continue learning together. And don’t forget to check out my book Visual Analytics with Tableau to take your data journey to the next level!

What other books have inspired you on your data journey? Share your favorite data books in the blog post comments or reply to this tweet: