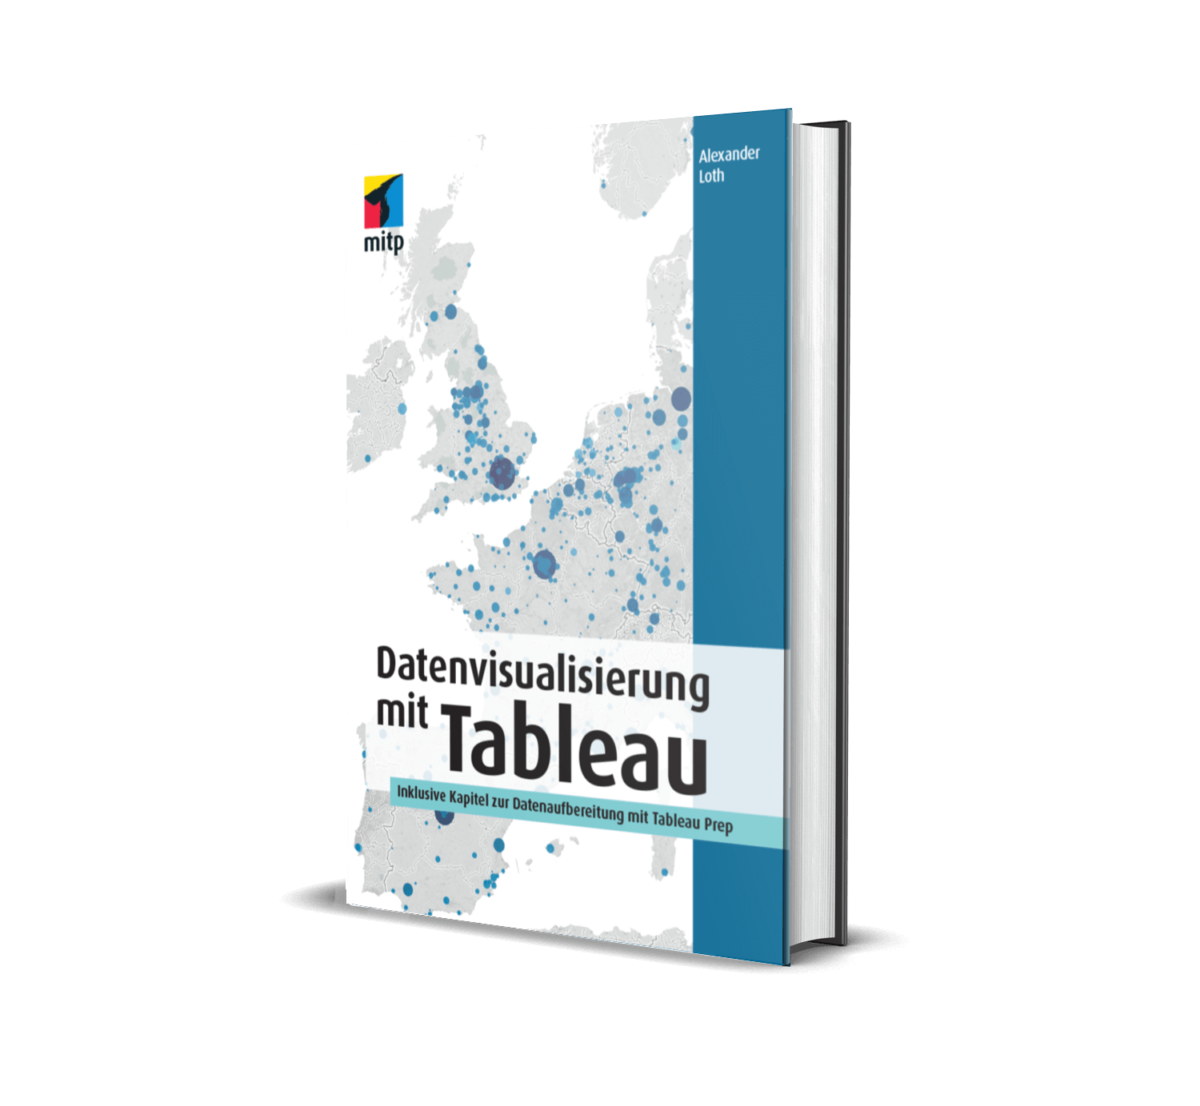
Heute ist ein spannender Tag für alle Datenvisualisierungsfans und Tableau-Nutzer: die zweite, verbesserte und erweiterte Auflage des populären 📖Datenvisualisierung-mit-Tableau-Buchs ist ab sofort verfügbar! Dieses aufschlussreiche und praktische Handbuch ist Ihr Tor zu effektiver und intuitiver Datenvisualisierung mit Tableau, einer der führenden Plattformen in diesem Bereich.
Die neueste Ausgabe zeichnet sich nicht nur durch ein auffälliges, strahlend orangefarbenes Cover aus, sondern beinhaltet auch rund 50 Seiten mit zusätzlichem Inhalt und eine Fülle von neuen praktischen Tipps. Basierend auf der aktuellen Version von Tableau Desktop, wurde die orange Edition mit dem Ziel erstellt, Ihre Fähigkeiten in der Datenvisualisierung zu verbessern und zu erweitern.
Wir möchten unsere Dankbarkeit gegenüber Dilyana Bossenz, Klaus Schulte, Martin Pohlers und Bhagat Singh Ransi aussprechen, deren Ideen und Unterstützung wesentlich zur Verbesserung dieses Tableau-Buchs beigetragen haben.
Um die zweite Auflage von Datenvisualisierung mit Tableau zu erwerben, fragen Sie in der Buchhandlung Ihres Vertrauens oder bestellen Sie das Tableau-Buch bei Amazon.
Writing Visual Analytics with Tableau was a labor of love and expertise, driven by my passion for helping others unlock the full potential of their data. Designed for both beginners and seasoned professionals, the book provides comprehensive insights and practical guidance for using Tableau to transform raw data into meaningful visual stories.
The journey to becoming the #1 bestselling book on business intelligence tools on Amazon was not a solo effort. It was made possible by the incredible support and feedback from the #DataFam community, a network of Tableau enthusiasts and experts who share a common goal: to excel in the art and science of data visualization.
The Best Way to Learn Tableau
Visual Analytics with Tableau stands out as a resource for learning and mastering Tableau, making it an essential reading for anyone looking to improve their data visualization skills. Whether you are a student, business professional, or aspiring data scientist, this book provides valuable insights and hands-on experience to help you navigate the world of Tableau with confidence.
Beyond its instructional value, Visual Analytics with Tableau also serves as a guide for organizations seeking to foster a data-driven culture. By implementing the techniques and best practices outlined in the book, organizations can make more informed decisions, uncover hidden insights, and drive innovation.
The Tableau book: A Note of Gratitude
I am incredibly grateful to our #datafam who has supported this project, from its early conceptual stages to its realization as a bestselling book. Your ideas, feedback, and enthusiasm have helped make Visual Analytics with Tableau a valuable and unique resource in the field of business intelligence and data visualization.
I encourage everyone to spread the word about Visual Analytics with Tableau and join the growing community of data enthusiasts who are reshaping the way we understand and interact with data. Together, we can continue to push the boundaries of what’s possible with Tableau and data visualization!
Wow, es ist noch gar nicht lange her, seit mein Buch Datenvisualisierung mit Tableau veröffentlicht wurde! Ich danke allen Lesern für die vielen postiven Rückmeldungen und freue mich, dass mein Buch Ihnen hilft Erkenntinsse aus Ihren Daten abzuleiten und diese im Unternehmen zu teilen.
Die erste Auflage des Tableau-Buchs ist nun auch schon fast ausverkauft. Daher stellt sich jetzt die Frage, ob es einen Nachdruck geben wird, oder ob es bereits Potential für eine erweiterte zweite Auflage des Tableau-Buchs gibt. Um das zu entscheiden, freue mich auf Ihr Feedback!
Teilt eure Ideen, Anregungen und Änderungsvorschläge für die zweite Auflage des #Tableau-Buchs! Gerne per Email oder als Reply zu diesem Tweet.https://t.co/T5JlRq5qbh
As you know from my previous Tableau Conference sessions and blog posts (TC18, TC17, TC16), I love social media! So thank you for your likes, shares, retweets…
Today marks a significant milestone in my journey with data visualization – the release of my comprehensive Tableau book, Visual Analytics with Tableau (Amazon). This book is more than just a guide; it’s a comprehensive resource for unlocking the power of visual analytics. Also, check out the Visual Analytics with Tableau companion website for further news.
From the Back Cover
A 4-COLOR JOURNEY THROUGH A COMPLETE TABLEAU VISUALIZATION FOR NON-TECHNICAL BUSINESS USERS
Tableau is a popular data visualization and analytics tool favored by financial analysts, marketers, statisticians, business and sales professionals, data scientists, developers, and many others who need to explore insights and present visual, easy-to-understand data. Visual Analytics with Tableau is an accessible, step-by-step introduction to the world of visual analytics. This up-to-date guide is ideal for both beginners and more experienced users seeking a practical introduction to the fields of data analysis and visualization. Through hands-on examples and exercises, readers learn how to analyze their own data and clearly communicate the results.
This guide covers everything you need to get started with Tableau, from the first steps of connecting to data, creating different types of charts, and adding calculation fields to more advanced features such as table calculations, forecasts, clusters, and R, Python, and MATLAB integration for sophisticated statistical modelling. User-friendly instructions for existing options within the Tableau ecosystem–Tableau Desktop, Tableau Prep, Tableau Server, Tableau Online, and Tableau Public–enable you to integrate, clean, and prepare your data and share your work with others.
Why Choose Visual Analytics with Tableau?
Latest Versions Covered: Stay up-to-date with the newest features of Tableau, plus Tableau Prep, Tableau’s cutting-edge data integration application.
No Prior Experience Required: Whether you’re a beginner or an expert, this book caters to all. No background in mathematics or programming is needed.
Exploring Data Visually: This book Focuses on the visual analytics functionality of Tableau rather than complex statistical programming.
Expert Guidance: Gain insights from Alexander Loth, Tableau’s thought leader, and world-renowned visualization expert. Alexander’s hands-on approach ensures a smooth learning curve.
Advanced Functionality: Dive deep into advanced Tableau functionalities and explore various data structures to elevate your analytical capabilities.
Top-notch Presentation: This book provides easy-to-follow instructions, full-color illustrations, learning tools, online resources, and more.
Endorsements
If you’re getting started with visual analytics and Tableau, this book will teach you everything you need to know to build the foundations and understand how and why to explore your data visually. Alexander has created a fantastic resource that guides you step by step through the process of preparing your data, using Tableau Desktop to analyse it and finding insights.
Eva Murray, Head of BI and Tableau Zen Master at Exasol
If you’re keen to go from beginner to expert in Tableau, Alexander’s excellent book gives you everything you need to know. With a crisp and clear style, he talks the reader through all aspects of Tableau, from data cleaning through data analysis and into sharing insight with others.
Andy Cotgreave, Author of Big Book of Dashboards and Technical Evangelist at Tableau Software
Visual Analytics with Tableau – an easy to understand book by Alexander Loth, one of Tableau’s very first employees based in Germany, a recognized speaker on countless conferences, and a Tableau Jedi. It contains both the basics and advanced Tableau features. If you ask me: there is nothing more you need to get started with Tableau!
Klaus Schulte, Professor at Münster School of Business & 2019 Tableau Zen Master
Get Your Copy of Visual Analytics with Tableau and Stay Connected!
Thank you to everyone who contributed to the success of this book! Grab your copy of Visual Analytics with Tableau on Amazon and embark on an enlightening journey through visual analytics. If you’re new to Tableau, don’t miss my blog post on joining a Tableau User Group, where you can learn, connect, and grow your skills.
Stay in touch for more insights on data visualization, analytics, and digital transformation. Follow me on Twitter and LinkedIn, and let’s continue learning together:
Manage Cookie Consent
We use cookies to optimize our website and our service.
Functional
Immer aktiv
The technical storage or access is strictly necessary for the legitimate purpose of enabling the use of a specific service explicitly requested by the subscriber or user, or for the sole purpose of carrying out the transmission of a communication over an electronic communications network.
Preferences
The technical storage or access is necessary for the legitimate purpose of storing preferences that are not requested by the subscriber or user.
Statistics
The technical storage or access that is used exclusively for statistical purposes.The technical storage or access that is used exclusively for anonymous statistical purposes. Without a subpoena, voluntary compliance on the part of your Internet Service Provider, or additional records from a third party, information stored or retrieved for this purpose alone cannot usually be used to identify you.
Marketing
The technical storage or access is required to create user profiles to send advertising, or to track the user on a website or across several websites for similar marketing purposes.