Tag: Data Visualization
-
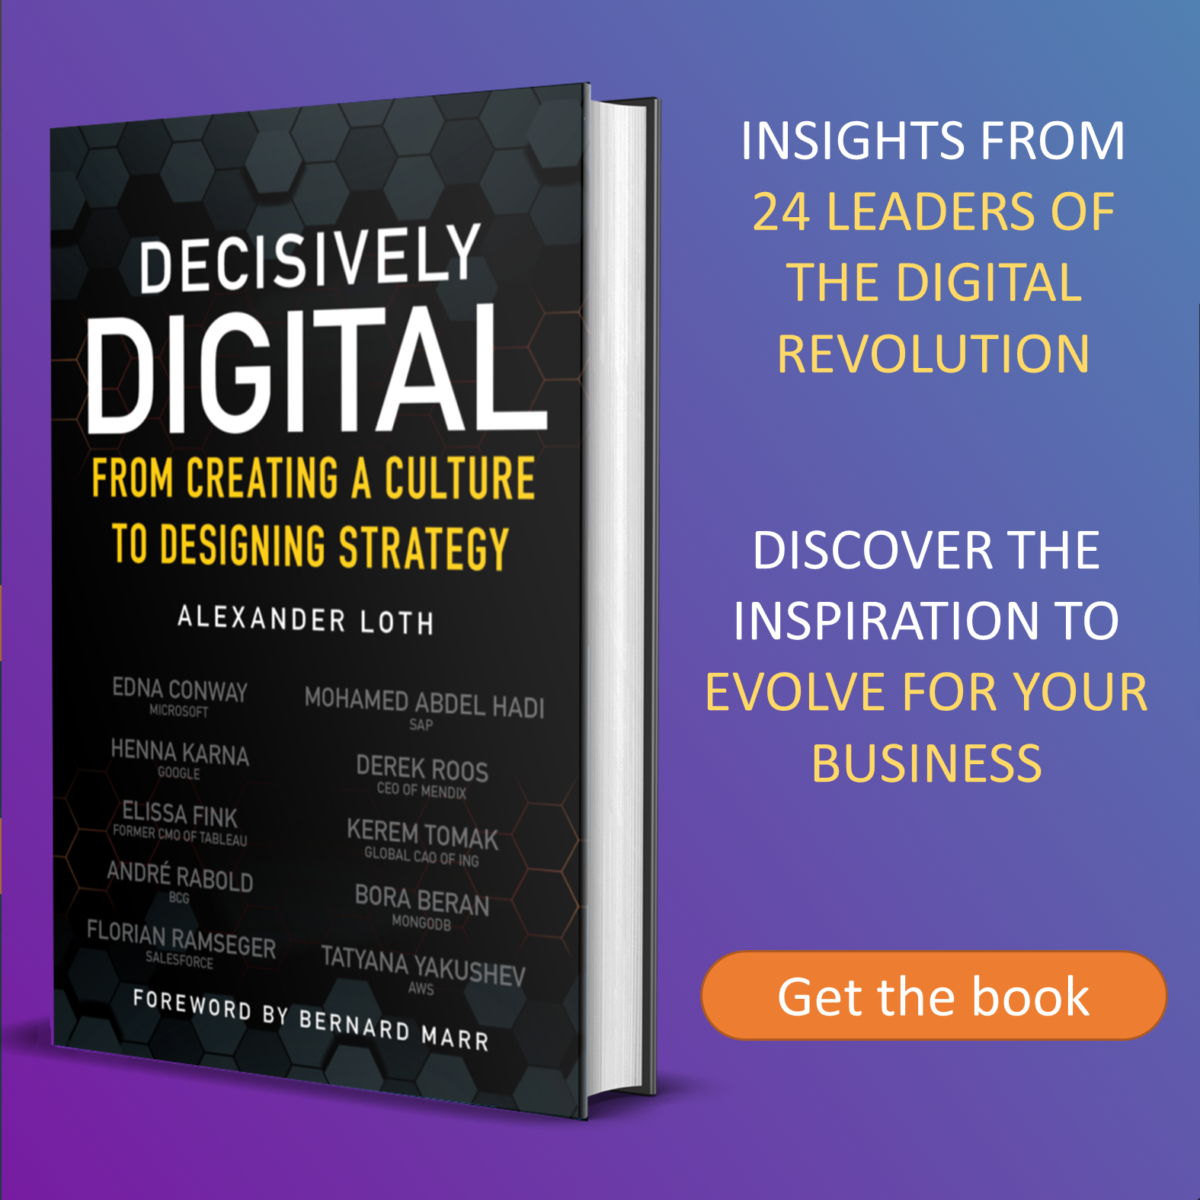
Decisively Digital — From Creating a Culture to Designing Strategy: Book is Now Available
My new book Decisively Digital — From Creating a Culture to Designing Strategy is now available for pre-order at most bookstores. The ebook is already available: Book’s website | Amazon | Barnes & Noble | Books A Million | IndieBound | Thalia | published by Wiley Check out 24 gripping interviews with Elissa Fink, Mohamed Abdel Hadi, Dr. Henna Karna, Derek Roos, Edna Conway, Kerem Tomak, André Rabold, Bora Beran, Florian Ramseger, Tatyana Yakushev, Patrick…
-
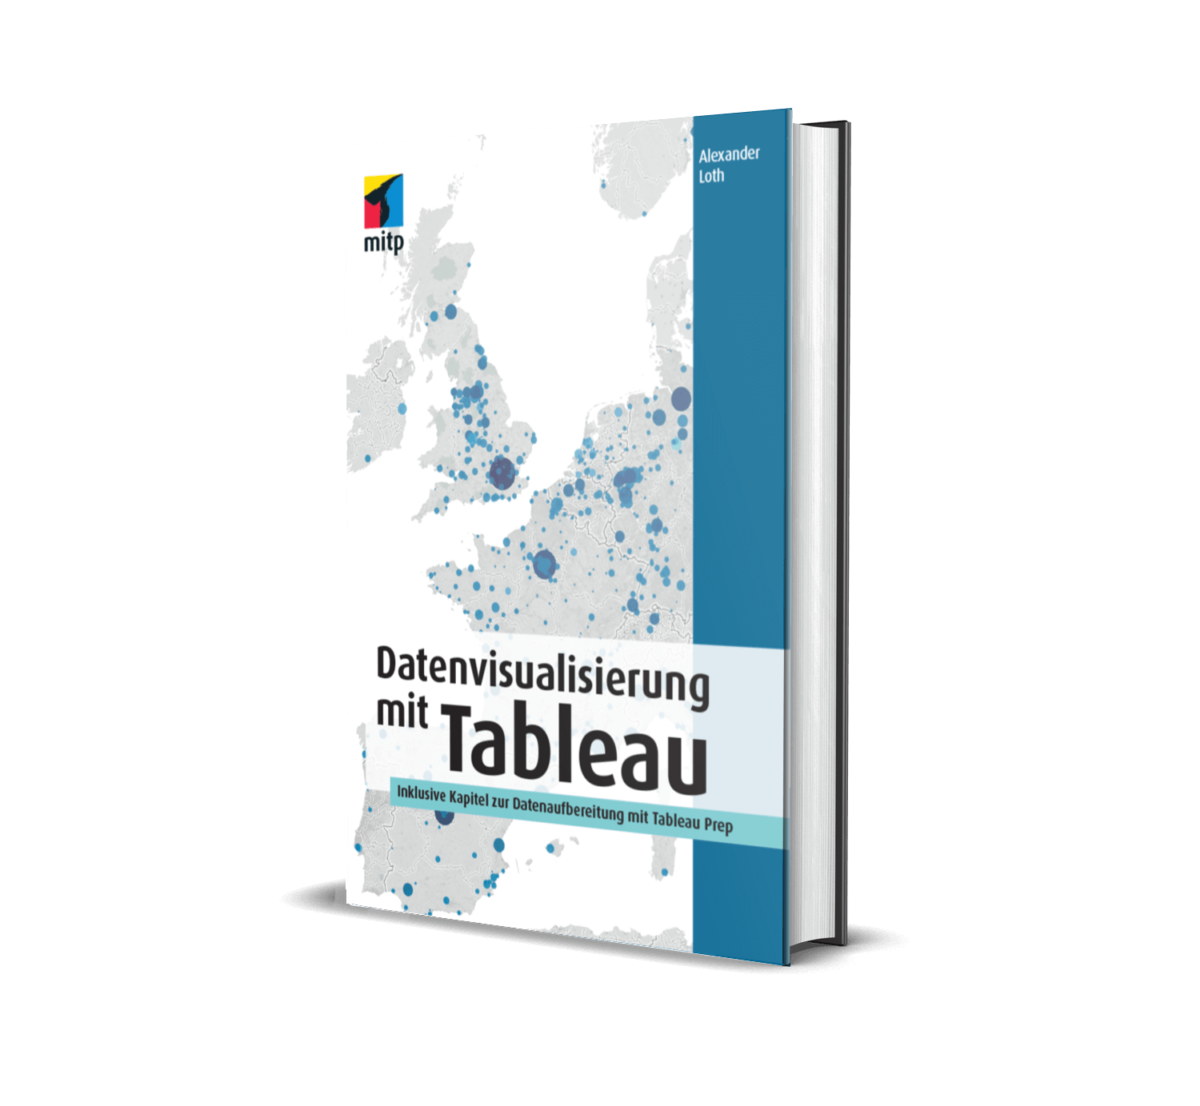
Datenvisualisierung mit Tableau: Geben Sie mir Feedback für die 2. Auflage des Tableau-Buchs
Wow, es ist noch gar nicht lange her, seit mein Buch Datenvisualisierung mit Tableau veröffentlicht wurde! Ich danke allen Lesern für die vielen postiven Rückmeldungen und freue mich, dass mein Buch Ihnen hilft Erkenntinsse aus Ihren Daten abzuleiten und diese im Unternehmen zu teilen. Die erste Auflage des Tableau-Buchs ist nun auch schon fast ausverkauft.…
